Some words about the background of
this visualisation:
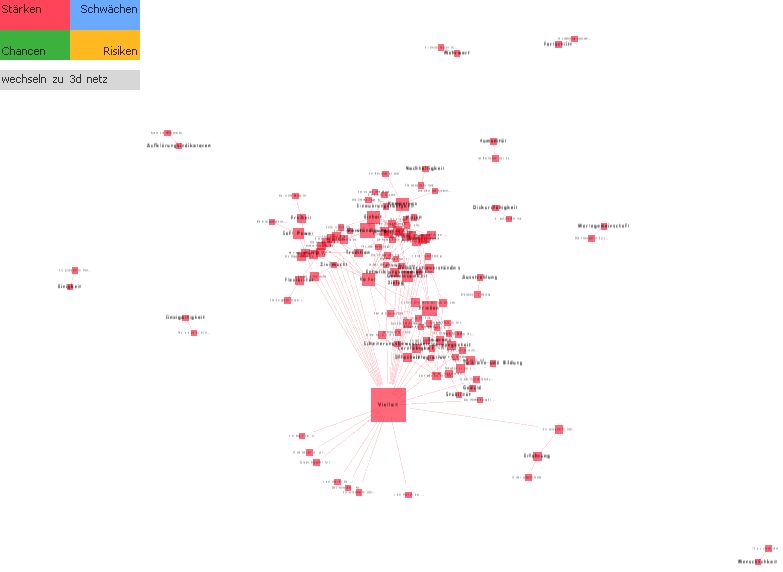
The visualisation is based on a SWOT
analysis. All delegates to the "sound of europe" symposion were
questioned on their opinions on the strengths, weaknesses, chances and
risks of the European Community.
In detail, each delegate had to chose a keyword and write an explaining
sentence on what is in her/his opinion, for example, a strength of
europe. The semantic network contains both keywords and sentences and
is determined by two rules:
For the keyword and the corresponding sentence a link is created,
If the keyword also appears in sentences of other questionaires,
a link is also created.
The kewords have been translated to german, the sentences are in their
original language.
a list of most frequently quoted keywords can be found here.
What does it tell us?
If we compare the networks for strengths and weaknesses, we see from
the shape of the network, that there is more consensus on the strenths
of europe than on its weaknesses.